


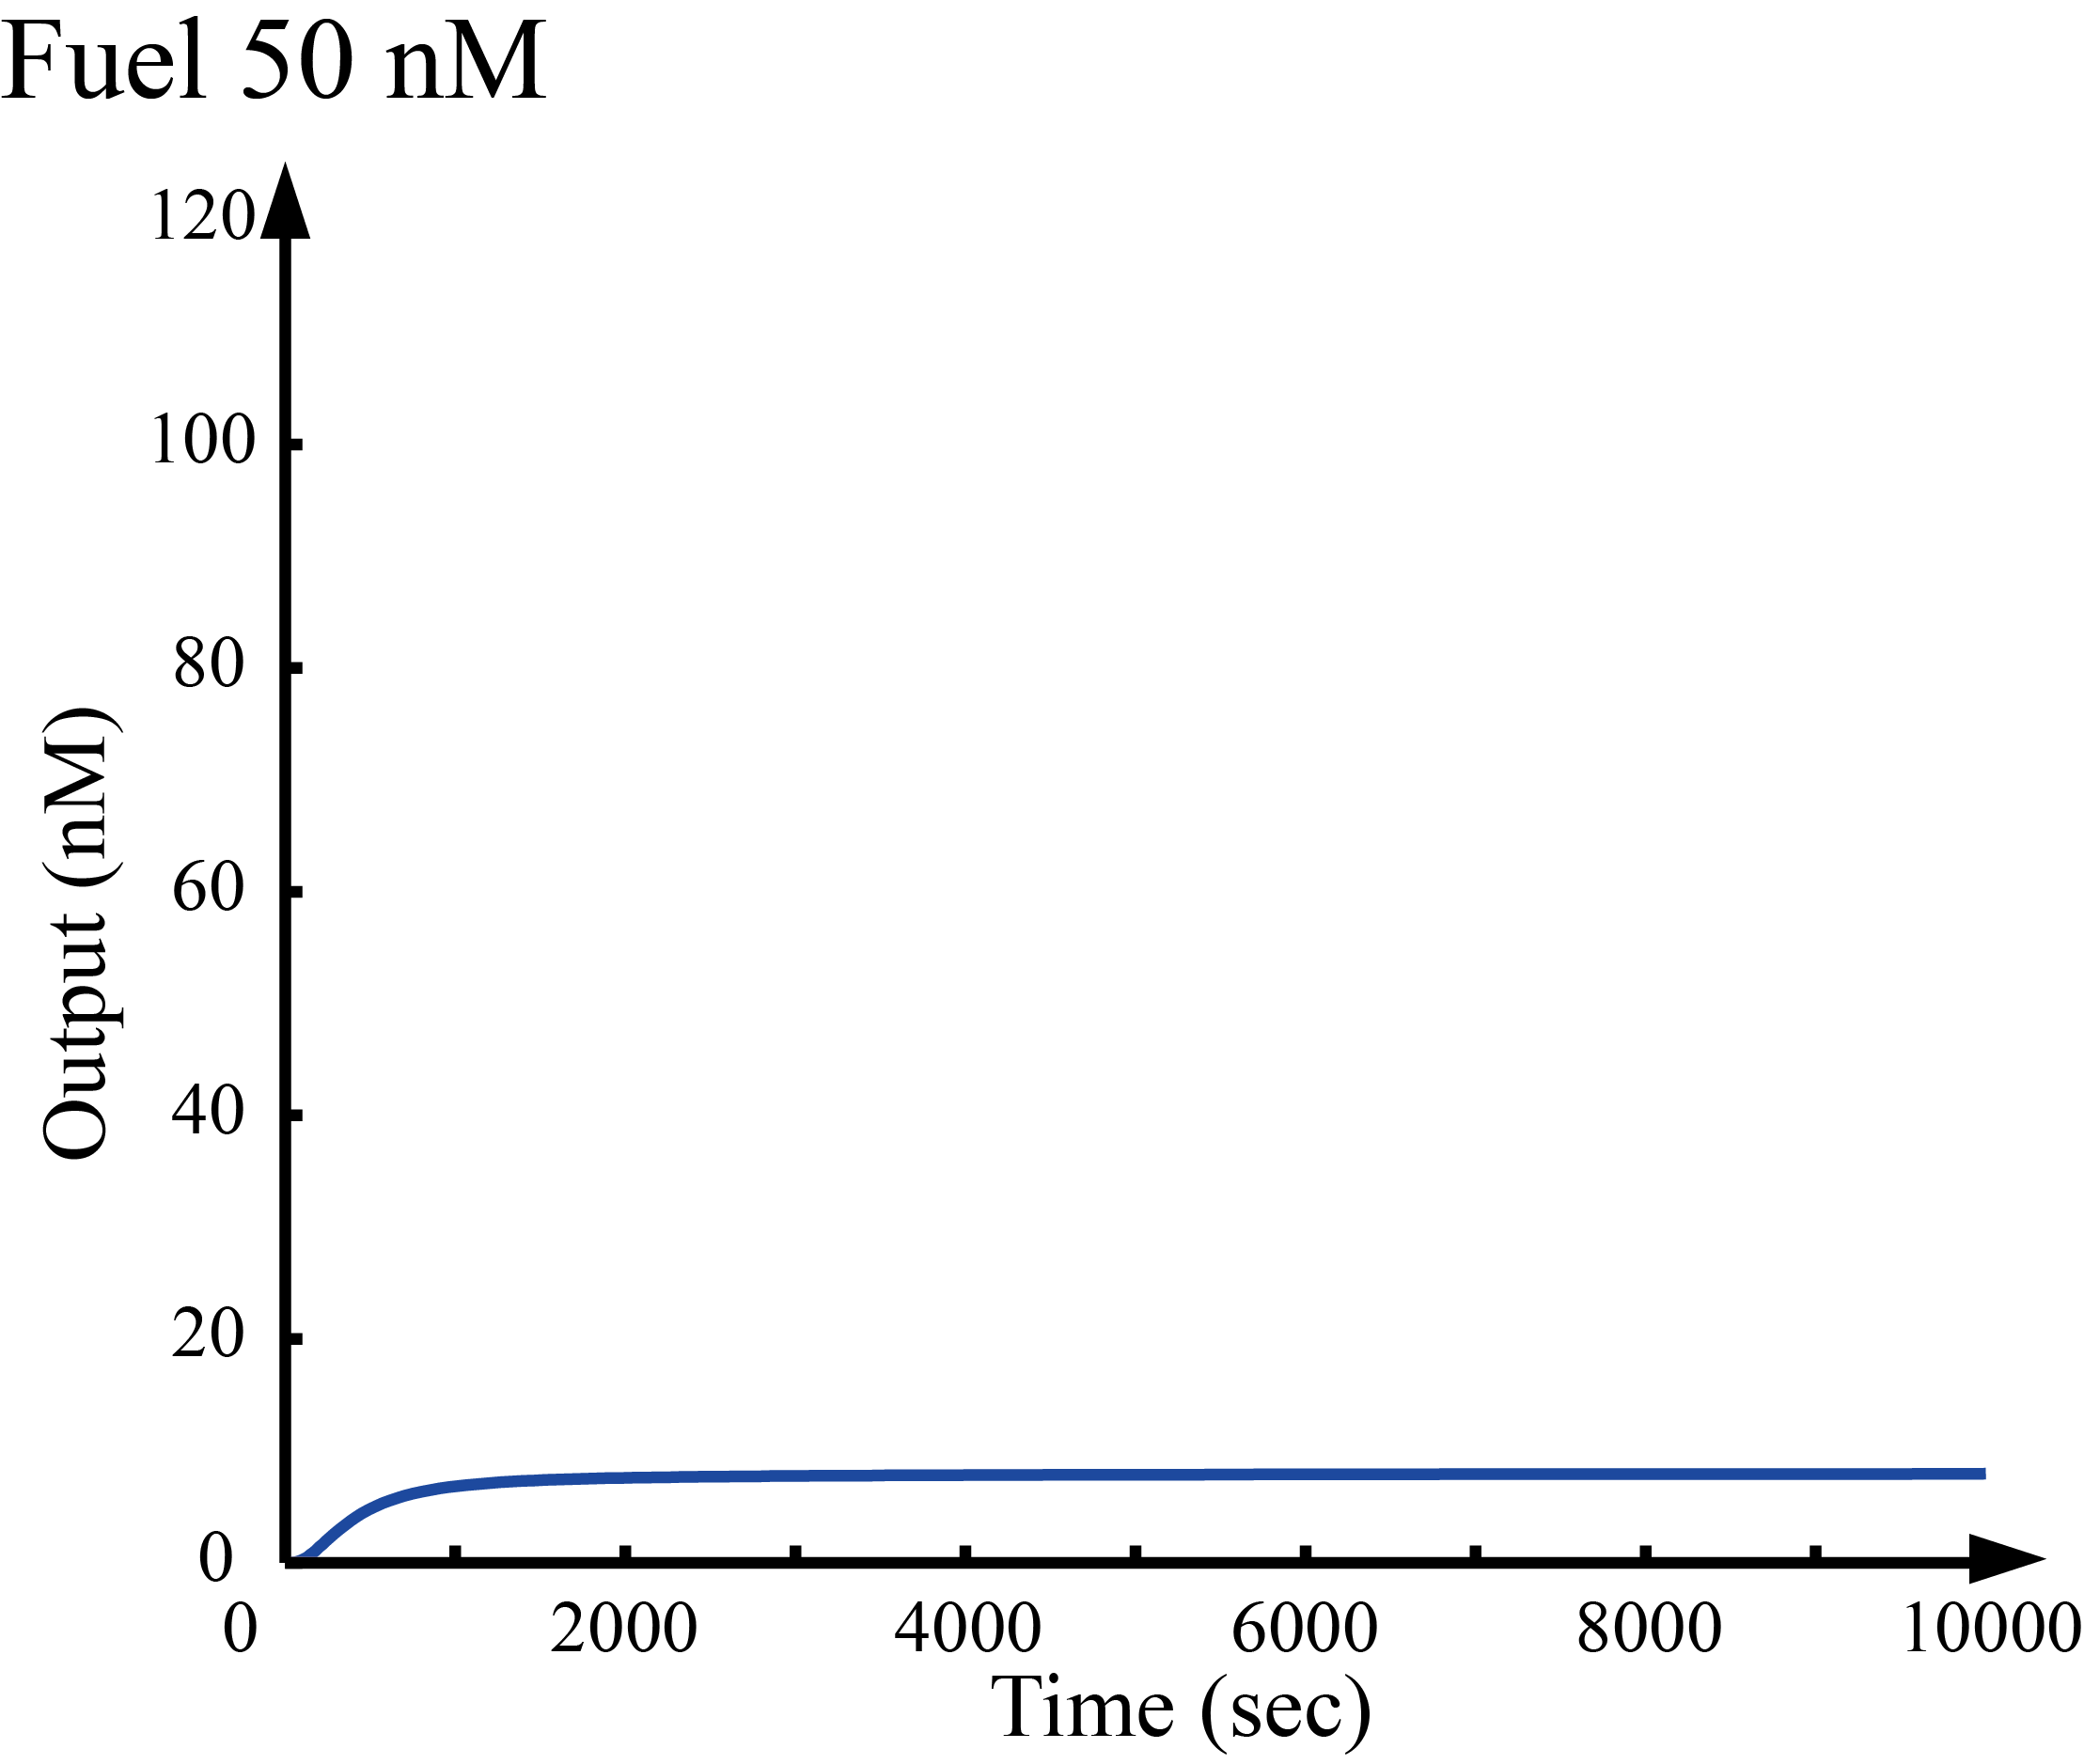
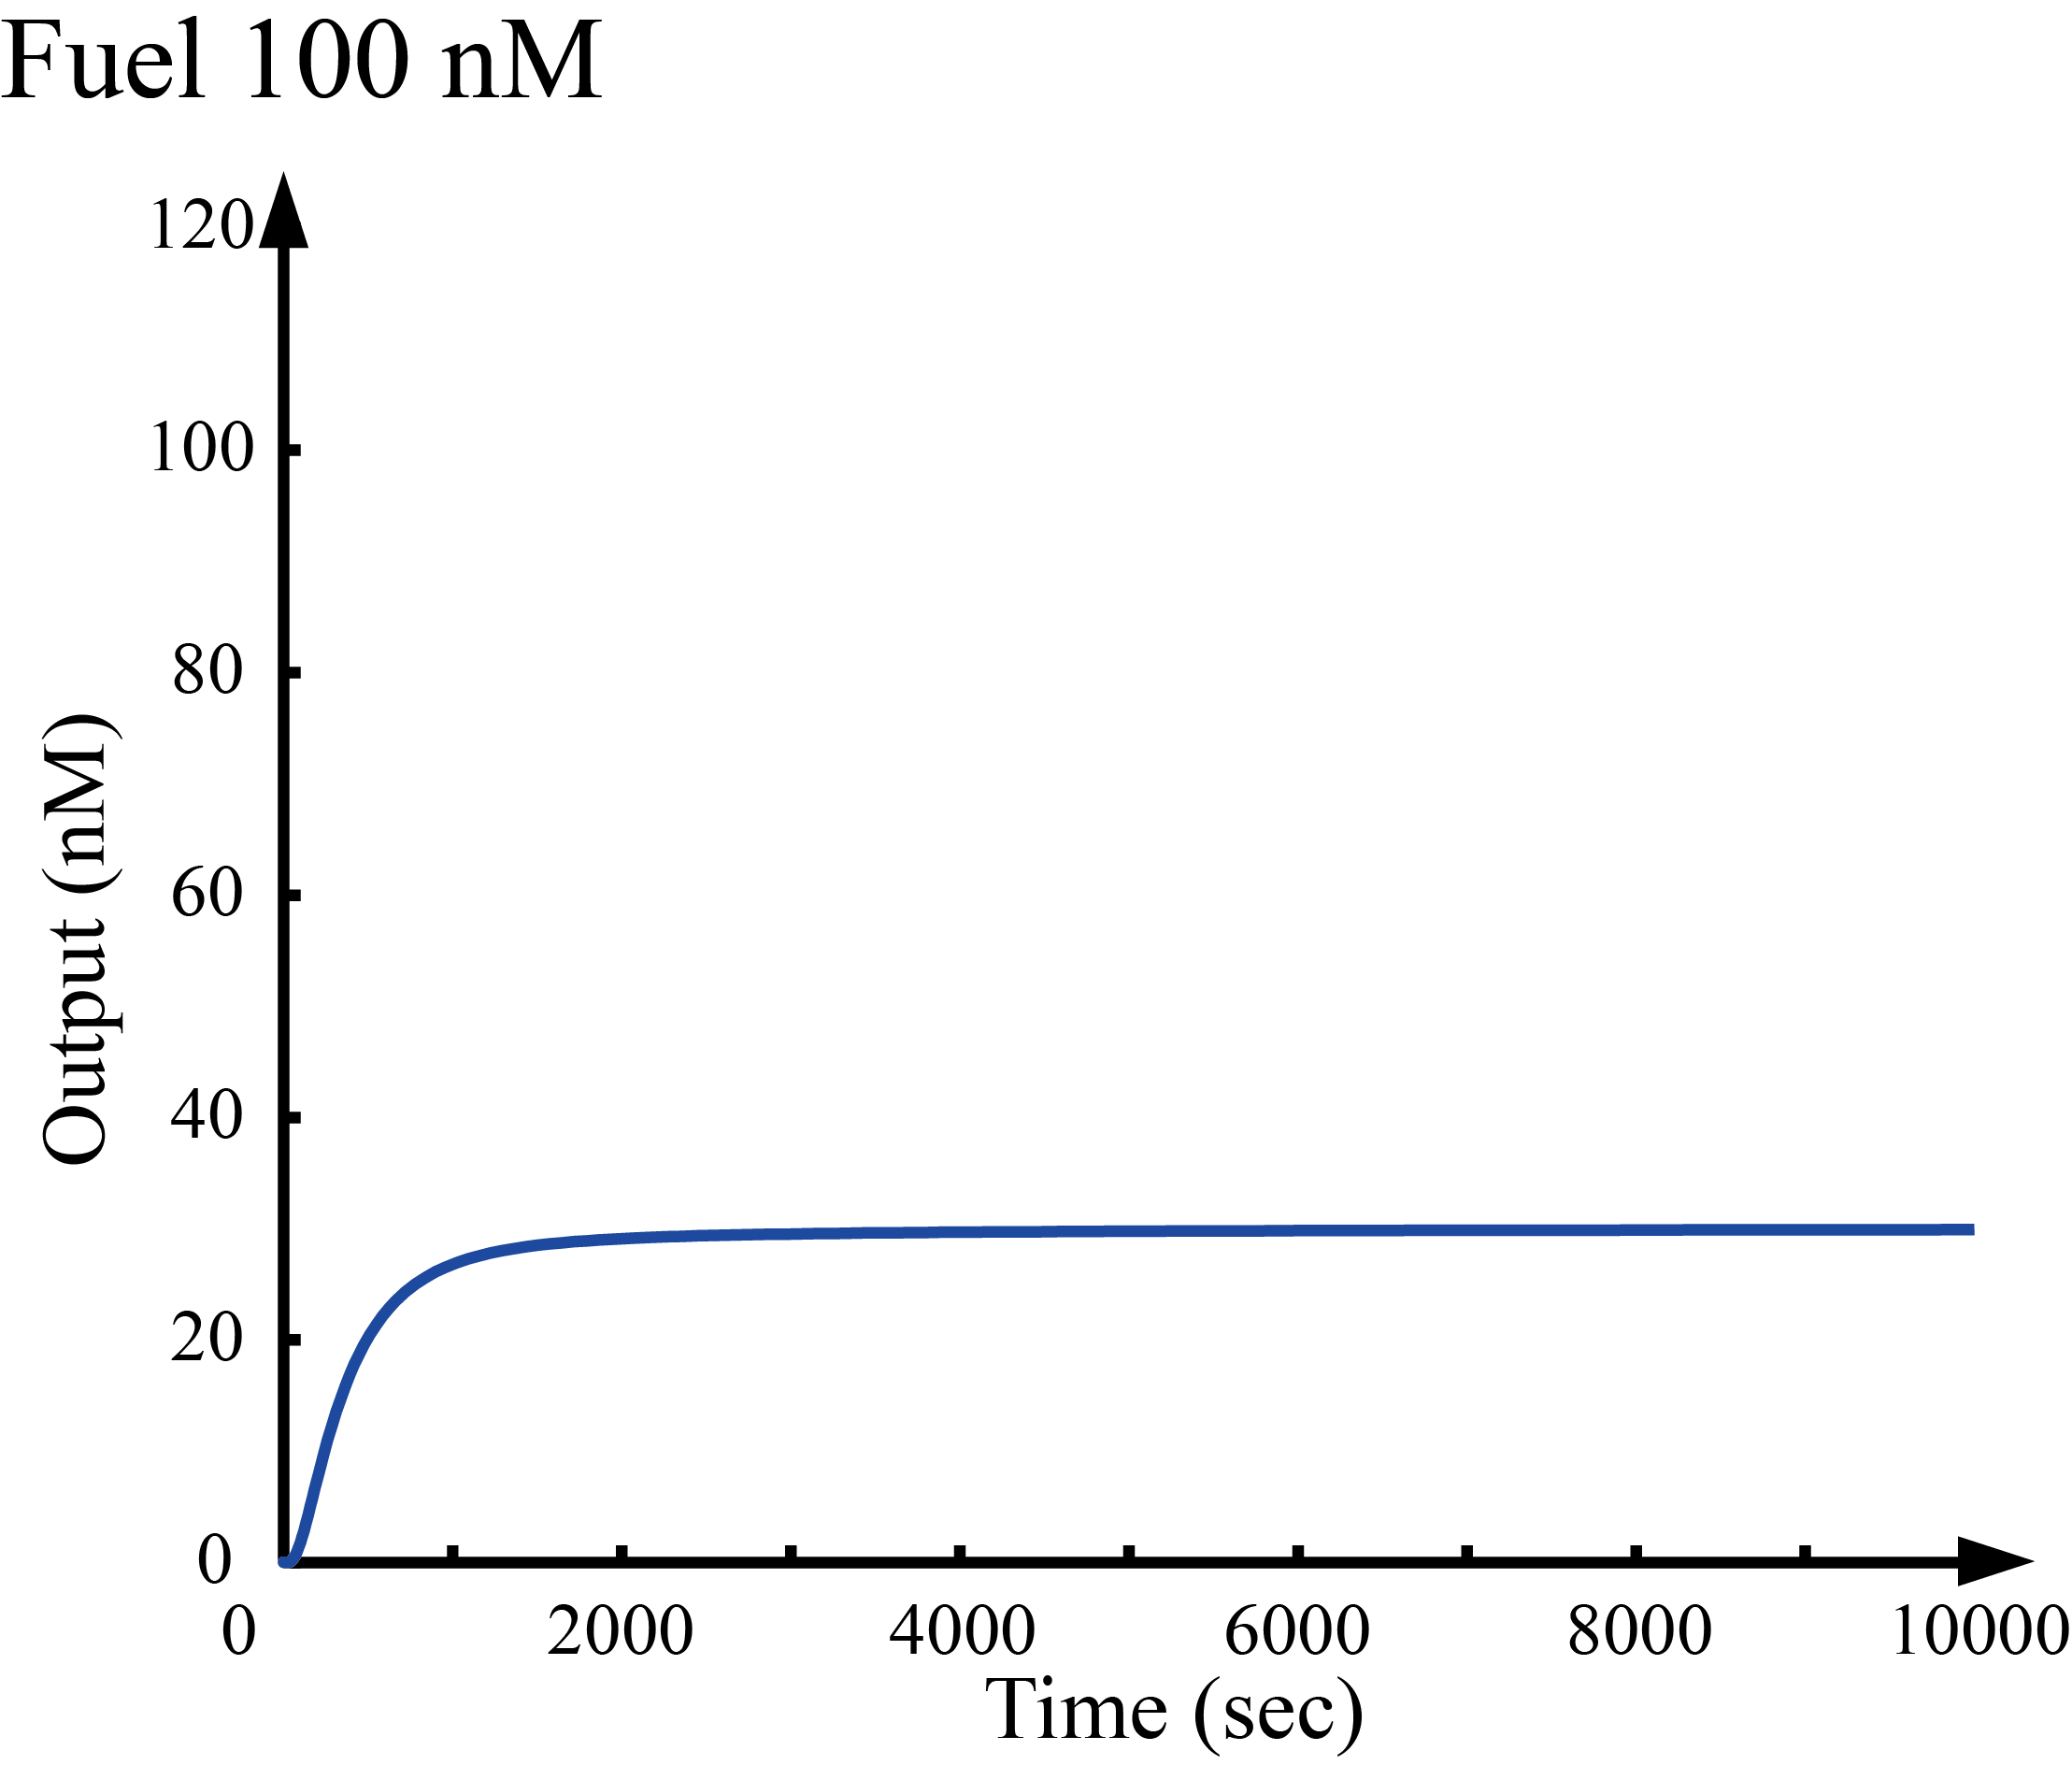
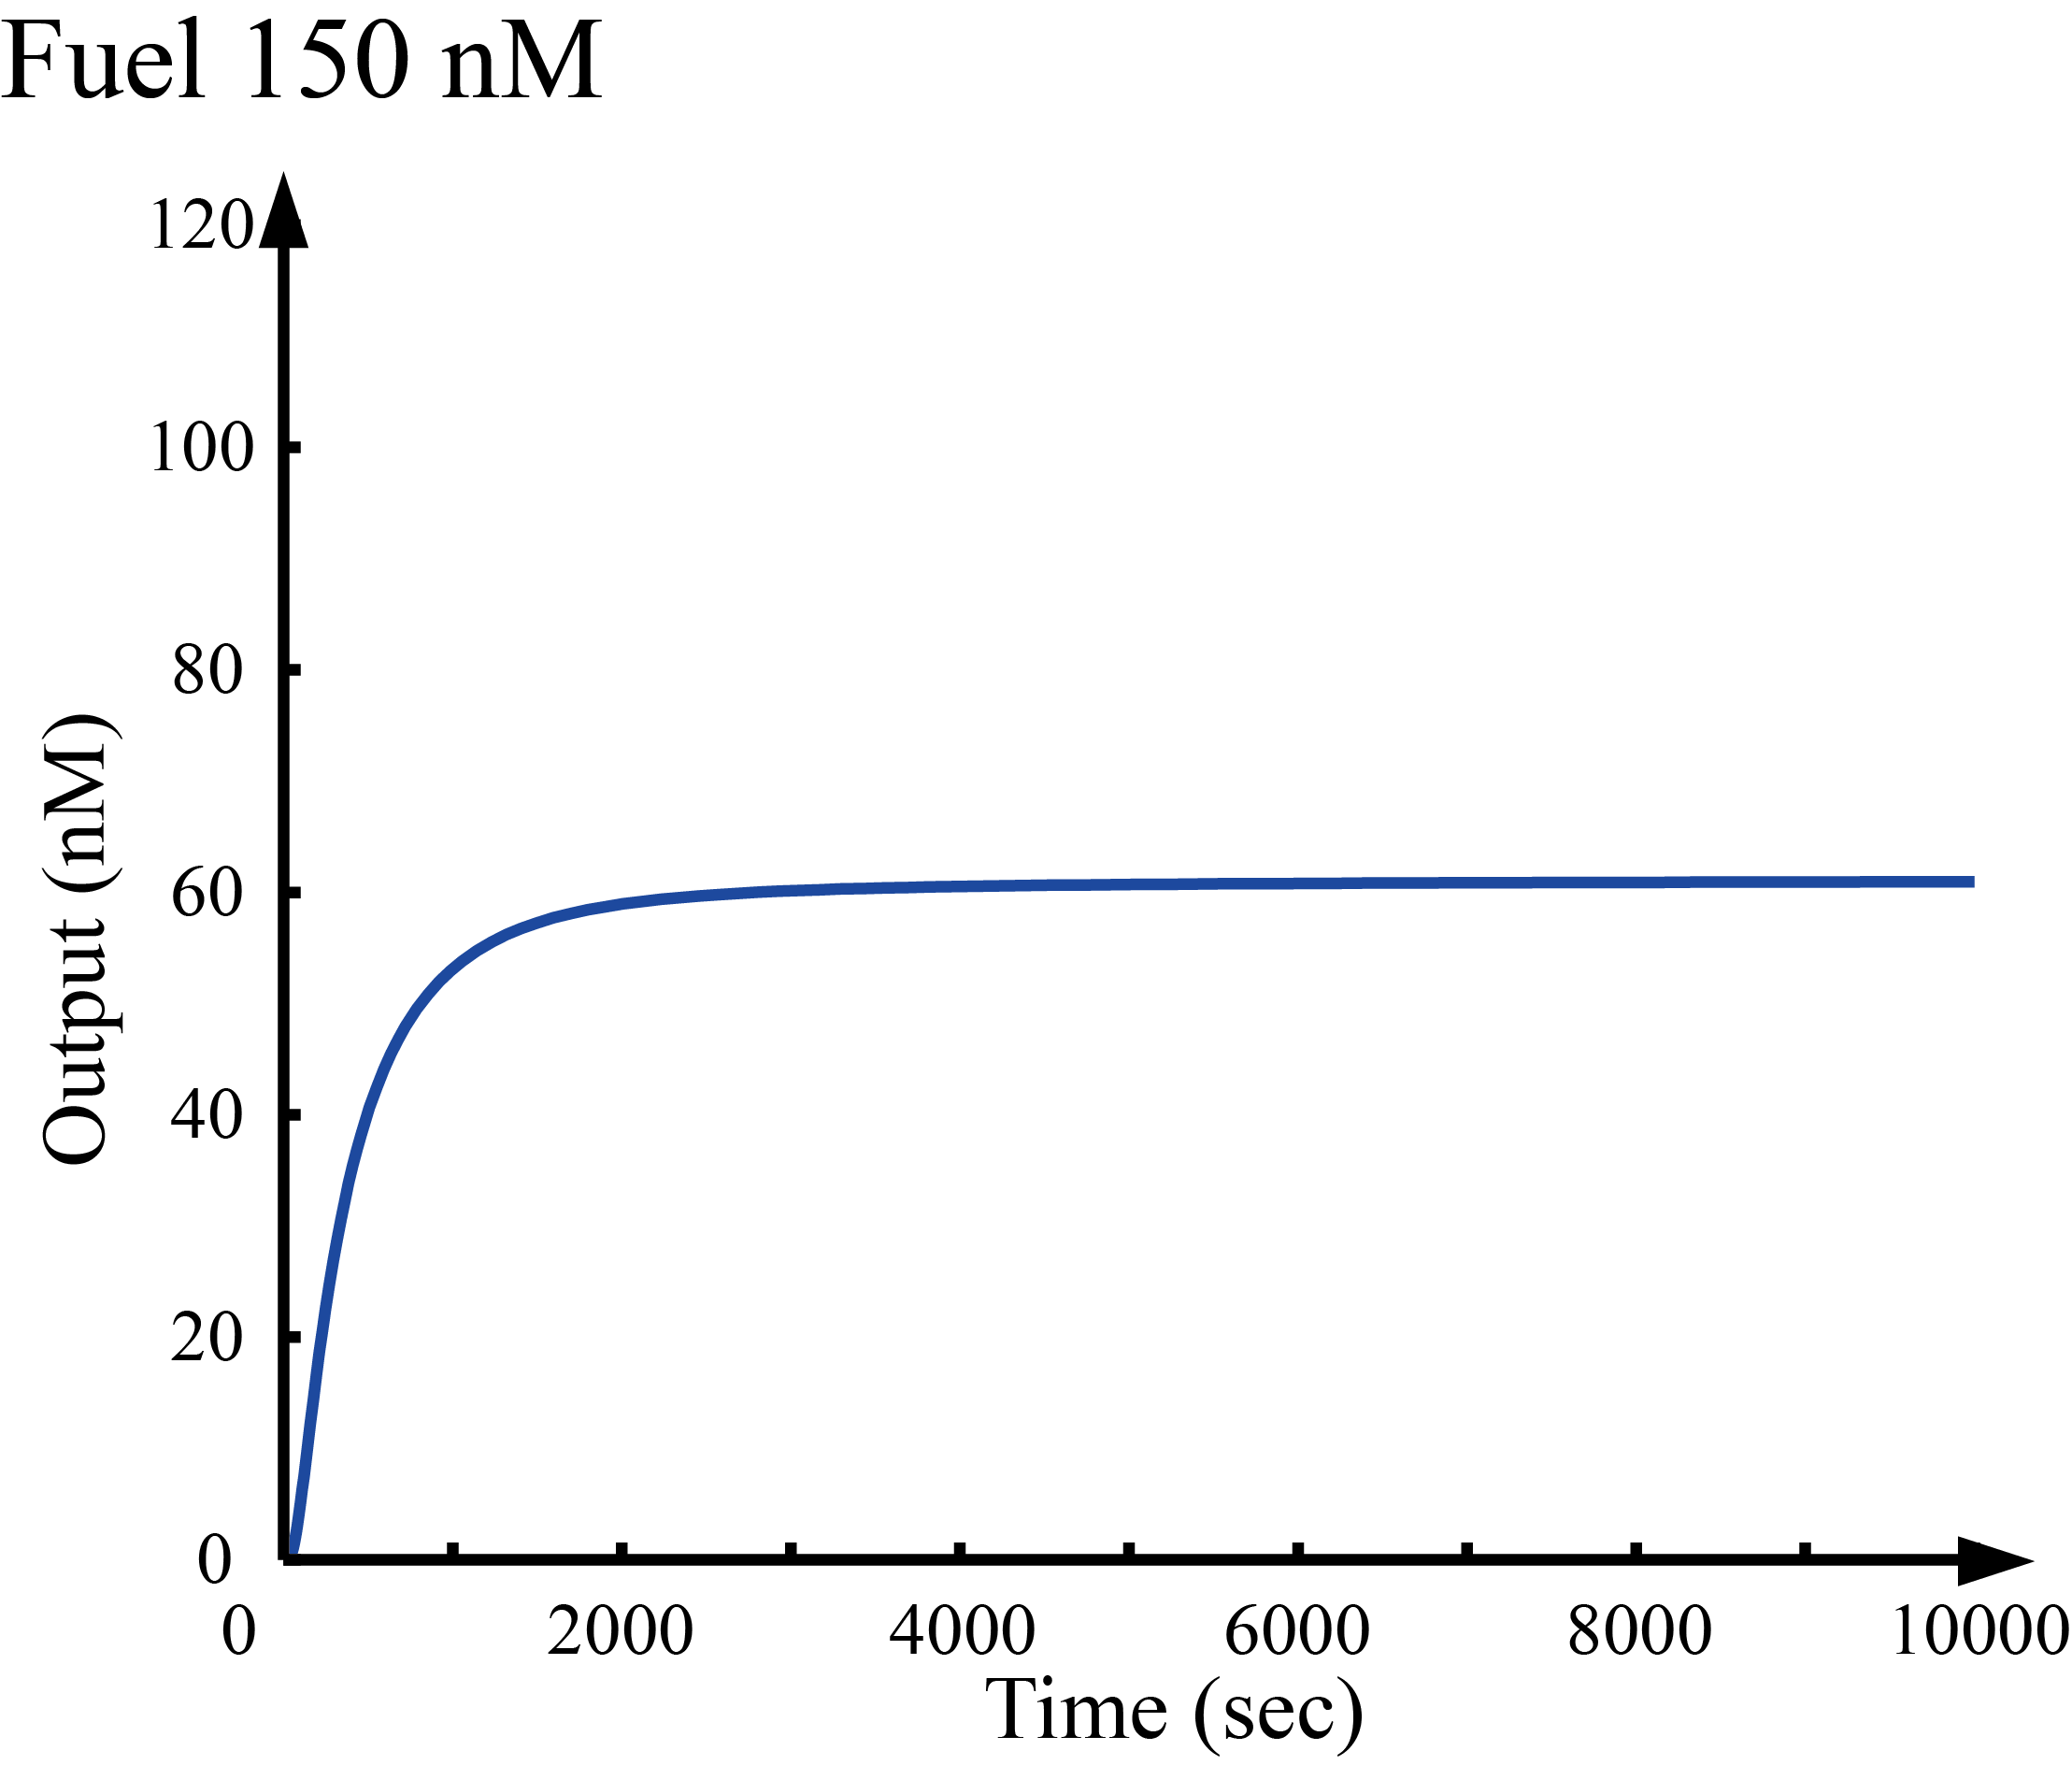
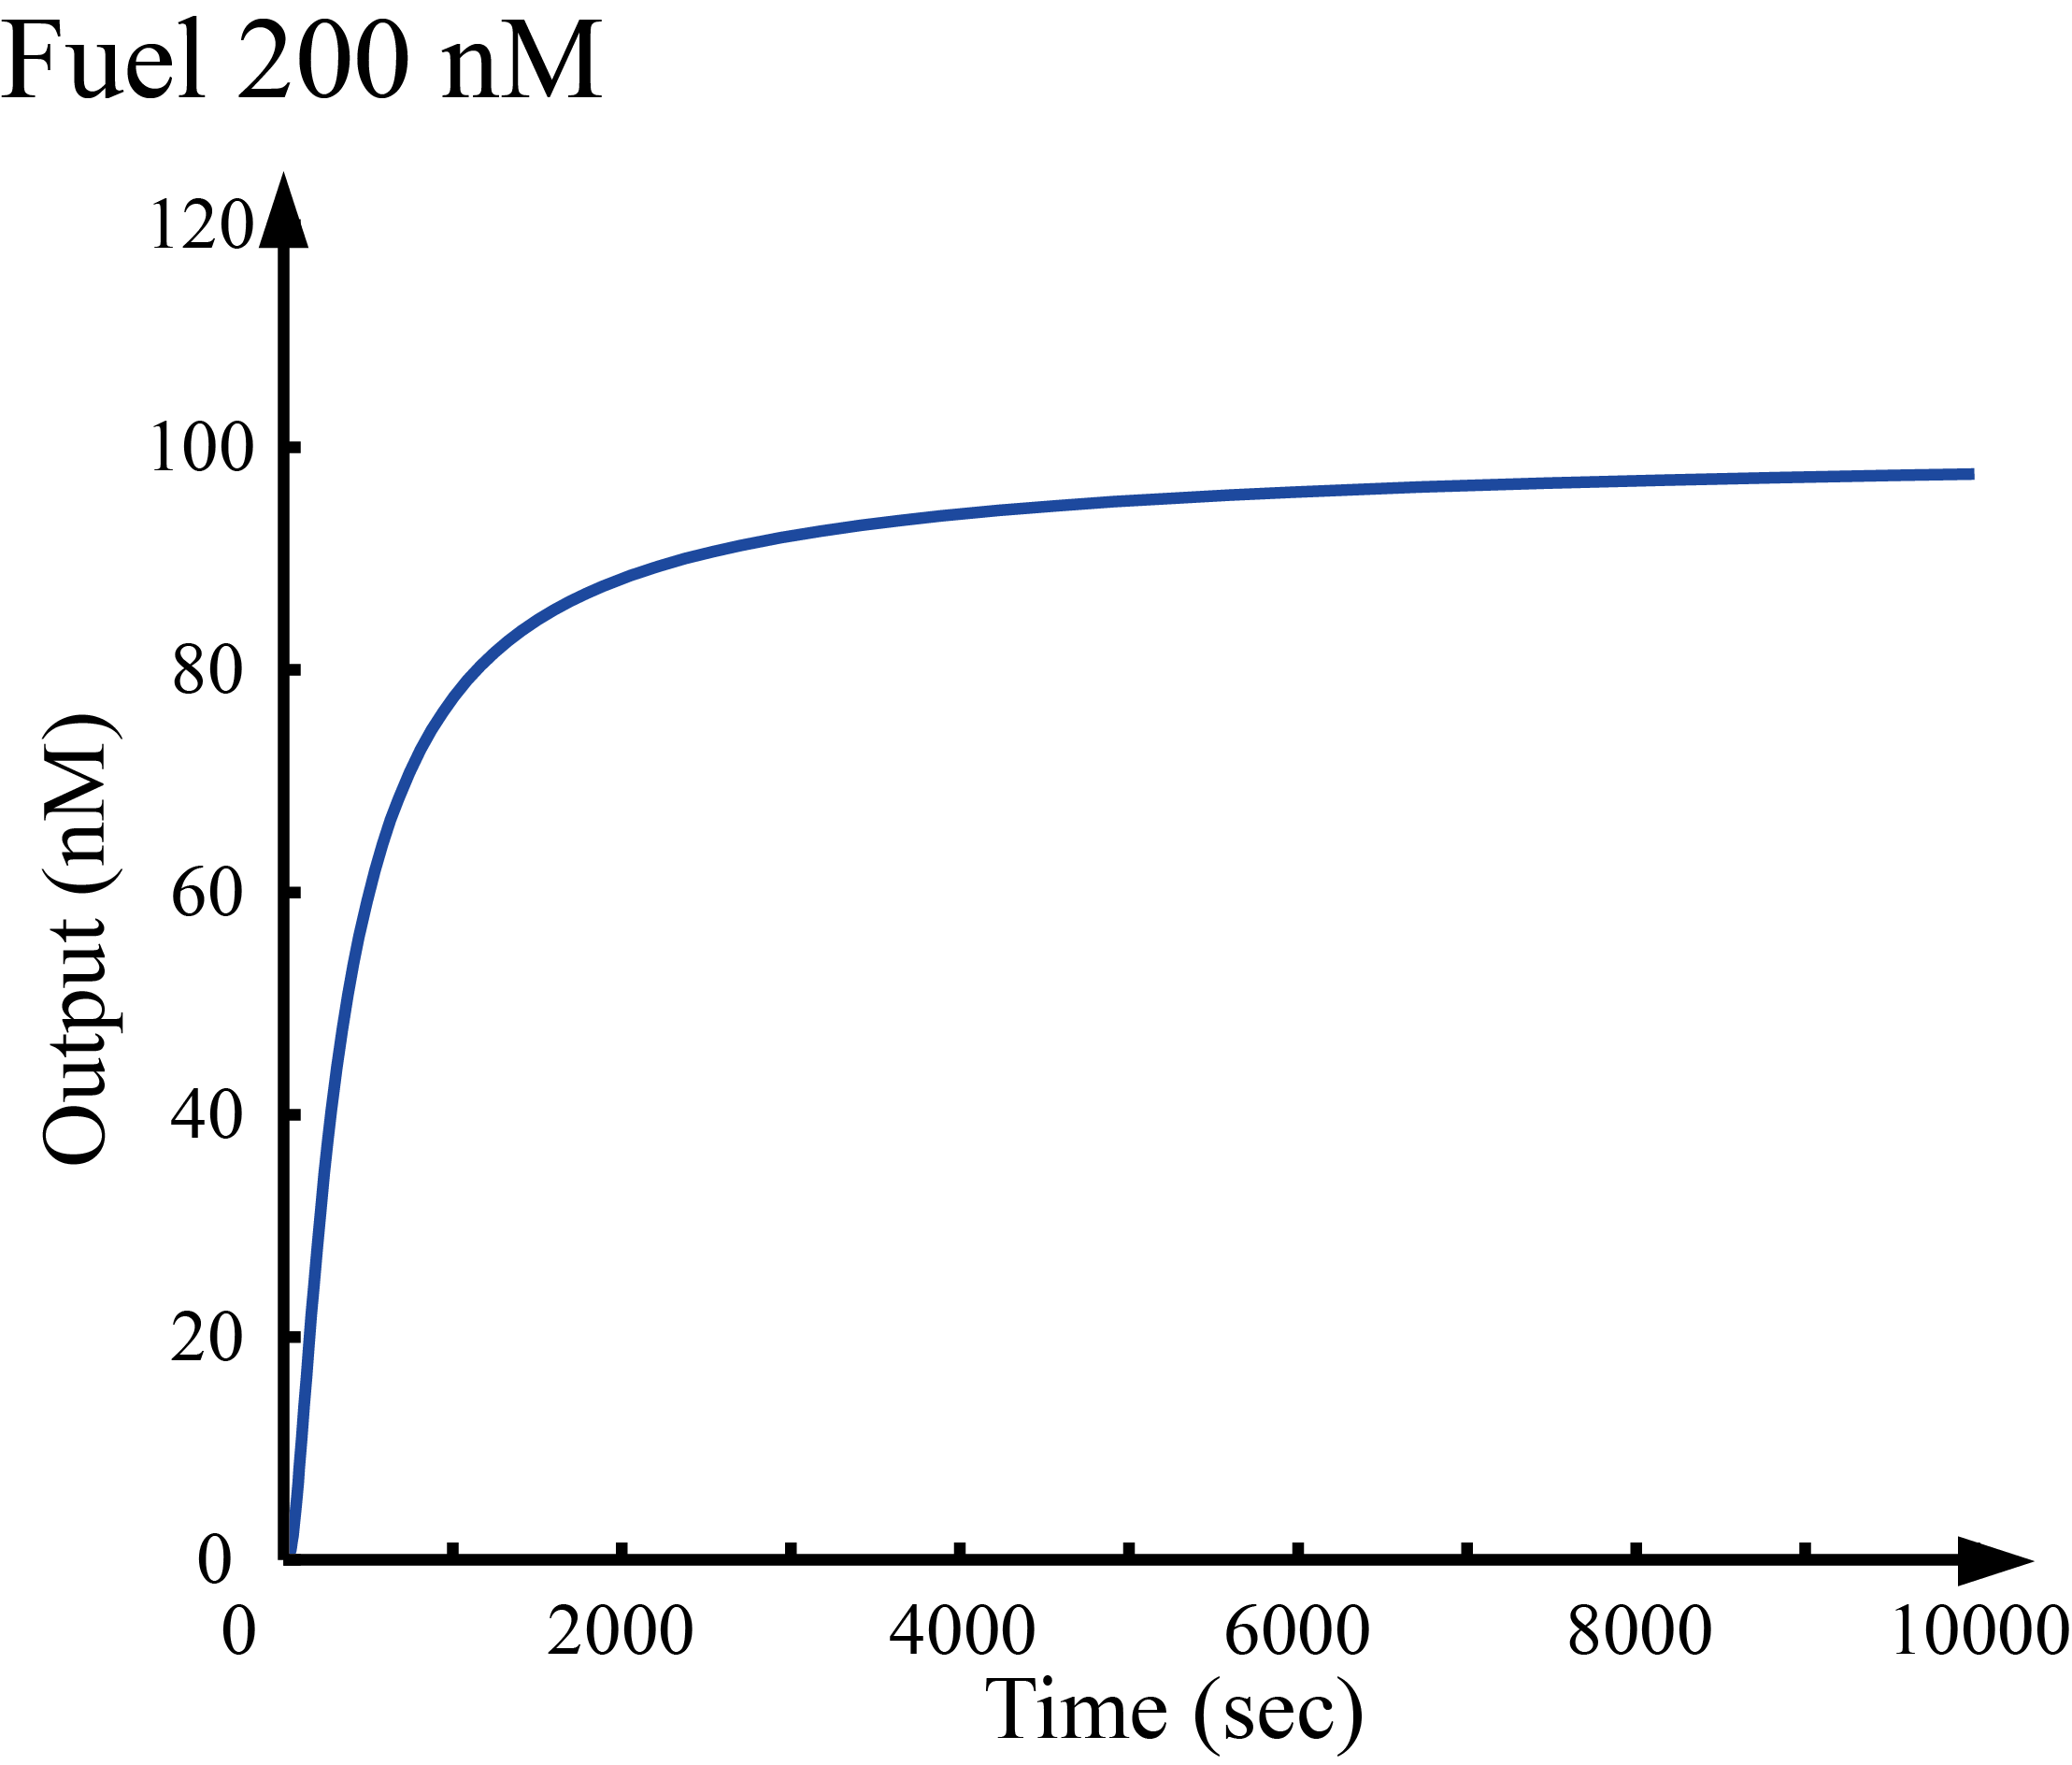
We performed simulations using Matlab[8] to confirm that the DNA Walker process depended on the initial concentration of Fuel. We simulated the time-dependent concentration change in output after setting the initial concentrations of DNA Walker and Ground to 100 nM and the concentrations of Fuel to 50, 100, 150, and 200 nM. Additionally, we simulated the concentration change in output when changing the initial concentration of Fuel from 0 to 500 nM with a fixed time of 10000 s. As shown in Figures 1–4, we found that the time-dependent concentration change in output depended on the initial concentration of Fuel.
As shown in Figure 5, the concentration of output increased rapidly when the initial concentration of Fuel was more than a specific value.
Additionally, the concentration of output increased rapidly above the threshold value as the levels of Spot increased (Types A–C).


We set up differential equations using state variables, such as x1 and x2, as shown in Figure 9 and conducted simulations. Similar simulation results are expected if the reaction between DNA Walker and Ground and a model in which the state transits similarly are considered. In this simulation, when Fuel was regarded as an input, the output was released only when the input exceeded a certain threshold, allowing the structure to function as a switch circuit.
